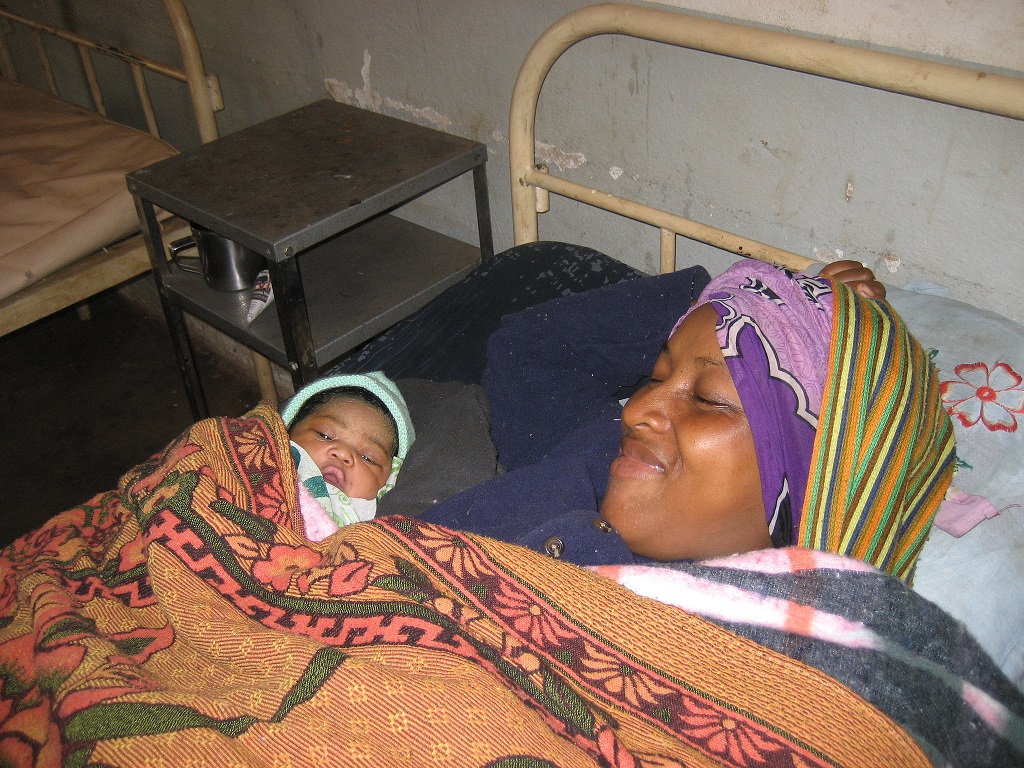
Use of a maternal and newborn health (MNH) dashboard has been key to dropping the umbilical infection rate in a rural Madagascar health facility from 40% to 0% in just two months. The innovative approach – implemented by MCSP to assist health facilities with data-based decisionmaking – was embraced by staff at Andranomeva Primary Health Center, who have institutionalized a 48-hour observational period for all women who recently delivered.
MCSP trainings improved the skills of the staff to provide care to mothers before and during childbirth, as well as newborns. This includes prevention of umbilical infection, a frequent complication in rural areas like Andranomeva.
The effective use of data and MNH indicators to guide decision-making at primary health centers is an important topic during the second week of MCSP’s training. Eight quality indicators selected from the World Health Organization and national indicators now compose the center’s dashboard, and data taken from existing registers and reports is fed into the system using information technologies comprised of:
- A data collection system for indicators on a DataWinners platform, which are transmitted via text message to a web-based system for calculation and interpretation;
- A large poster mounted at every health facility displaying graphs of monthly values of eight MNH quality indicators, with color-coded results that correspond to the score card of the Ministry of Health’s Family Health Division; and
- A web application that allows monitoring of dashboard data at the individual facility level and across all targeted health facilities.
After the training, midwife Noëline Ramananjanahary began systematically transmitting her facility’s data each month via text message and receiving the color-coded results: green (within acceptable standard of performance); yellow (below acceptable standard of performance); or red (warning / low standard of performance). With visualization of health data through the dashboard, health facilities can quickly address challenges to the provision of quality health services and can easily refer more complex issues to higher-level departments, if needed.
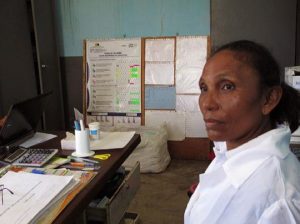
To her surprise, the dashboard revealed a result of 40% for the indicator tracking the proportion of umbilical infections at her health center, meriting a red color code and indicating poor performance. Recognizing the impact this indicator had on overall quality of newborn health services, Noëline immediately checked the management tools to better assess the situation and verify the number of cases of infection at the health center.
“I decided to reorganize the [maternity ward] service to keep mothers and newborns for 48 hours after birth for more monitoring,” she said. As a result of these efforts, within two months, umbilical infections at the facility were eliminated.
The MNH dashboard system was first implemented by MCSP in four regions of Madagascar with plans to extend the initiative to all health facilities in the project’s 15 targeted regions. Early dashboard successes have generated interest from the local district health management team and the Sofia region’s health management team. These groups are being trained on the use of the web platform to allow them to monitor the performance of health centers within their catchment areas, and to discuss solutions to improve the quality of health services.