This post originally appeared on JSI’s “The Pump” blog.
As we celebrate World Immunization Week, it’s important to remember that one way to “close the gap” on immunization services is by re-examining the wealth of data currently available at the country level and empowering health workers to leverage their historical data to reach their target populations more effectively.
The Expanded Program on Immunization has been in existence in most countries for more than 30 years. In the field of immunization, we are accustomed to collecting data: coverage by antigen; dropout between doses of the same vaccines; target population figures; enumeration and locations of these populations. We have reference documents, such as Immunization in Practice, that have been used in training for decades and updated regularly. We also now have dashboards and technology to help us synthesize and report these data.
But are we helping the end-line users and those collecting the data at its source to make decisions themselves with their own data? Are we too focused on the short-term data (this month, this year) and not on analysis of the trends and how our program and activities are faring over time?
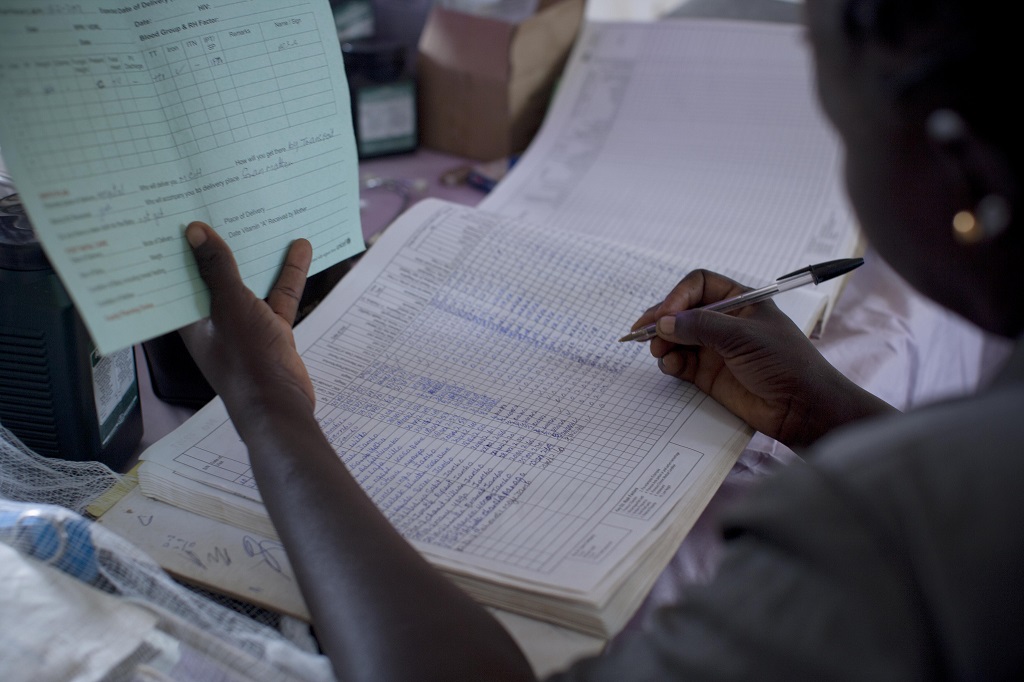
Earlier this month, during World Health Worker Week, I wrote about two exceptional health workers in Zanzibar I met when I participated in the national EPI review with support from MCSP, who use paper-based data collection tools to document infant and child health visits. What I didn’t show were the archived registers, monthly report summaries, and wall charts that provided a more comprehensive picture of the last three years of coverage and drop-out data. As instructed, the team had taken the time to complete and update these, with their most recent data (pictured below) taken on the day of our MCSP-supported visit.

However, supervisors often do not look back at these archived data and analyze trends. And because what gets monitored is usually what gets measured, health workers – despite filling out these tools – may not be encouraged or supported to do this analysis with their own data. As a result, we invest in higher tech and supposed “quick wins,” create new dashboards, and critique paper-based systems. We do all this without necessarily looking at where existing tools are working and could be strengthened or emphasized with health workers, potentially resulting in more cost-effective, user-centered benefits.
Data trends can also tell us a lot about performance over time and help us to learn from previous lessons and experience. I started working in Madagascar in 2001 on the USAID-funded BASICS project. That work linked with other USAID projects like Jereo Salaama Isika, ImmunizationBasics/JSI and SanteNet, and was done in collaboration with the Ministry of Health (MOH)/SV (immunization department) and partners such as the World Health Organization, UNICEF, Gavi, and World Bank. Immunization data were analyzed and used with regional, district and facility MOH staff to identify the reasons for weaker immunization performance. Reviews with those working in the field also helped to target approaches like Reaching Every District and Champion Communities, engaging those communities to help address immunization needs.
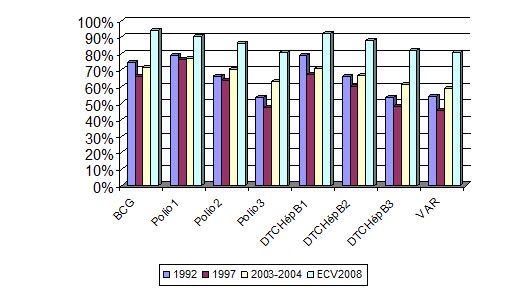
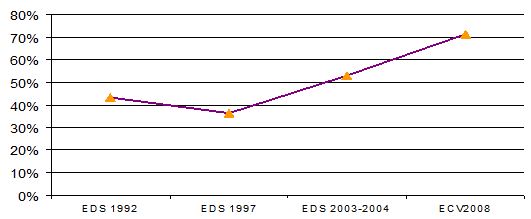
As evidenced in the 2008 Madagascar coverage survey (Figures 2 and 3), there were improvements in coverage and efforts to put data tools (such as vaccination cards) in the hands of parents and mobilizers.
We also know, however, that sustainability can be fragile in the face of political crisis, natural disasters, and economic challenges. Madagascar has experienced all of these since 2009, with the functionality of health services – including immunization – negatively affected.
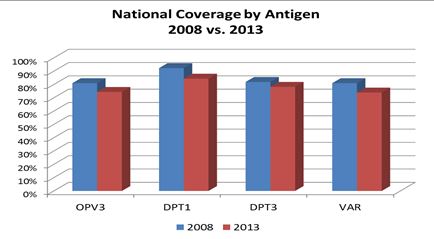
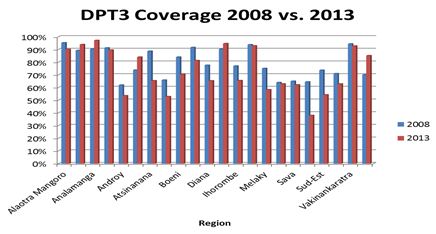
The 2013 coverage survey data show the results, as seen in the differences between the 2008 and 2013 surveys for the national coverage by antigen (Figure 4) and regional coverage for DPT3 (Figure 5). Although emphasized and valued by the health system and parents, child health card availability has also been compromised, as evident from Figure 6, which shows how card availability significantly declined throughout Madagascar after 2008. However, a handful of regions (such as Haute-Matsiatra, Analamanga and Vatovavy-Fitovinany) have withstood the challenges of the last several years and maintained higher or even increased coverage.
As part of our work with Gavi,the MOH/SV and partners, we wanted to learn what these more successful regions and districts are doing on the ground, particularly given continued resource constraints. During the CSO Coordination and Harmonization Workshop for Immunization held in Antananarivo in September 2014, we requested an MOH representative from the Haute-Matsiatra region to explain what was working. The text box below summarizes her recommendations for a strong health service delivery system.
Recommendations for Improving Health Services from an MOH Official in the Haute-Matsiatra Region of Madagascar
Crisis and problem identification- Consensus-building on situational analysis and how to make improvements together
- Included key influencers across interventions
- Built upon the Champion Community approach
- Had a health committee (including COSAN) to monitor whether agreed health interventions were being implemented (eg, latrines used, village cleaned)
- Community dialogues involving various partners, including with health staff – able to advocate with DRS for additional health staff to support the one nurse (added another nurse and midwife, health waiting room for accompanying family built by community, commodities and equipment to the CSB provided by JSI/Mahefa and the SSD).
- For monitoring and evaluation, have a plaque with indicators at the CSB (and DRS) where the results are visible to all and updates are presented at community meetings.
The best practices above have been discussed and incorporated more broadly into recent immunization and Gavi co-funded Health System Strengthening initiatives in Madagascar, as well as shared in regional fora (such as the recent Reaching Every Community workshop in Cape Town). USAID, Mahefa, Mikolo, MCSP, UNICEF/PASSOBA, Gavi and other partners are also working with the MOH at sub-national levels to improve immunization data quality and use, including with health facility staff and communities.
After years of severe constraints, Madagascar is still struggling to rebuild and further strengthen their immunization and public health system. However, the country has a history of data use for decision making by both health workers and communities from which to learn. Like this health worker pictured below in Miandriavazo, Madagascar in 2005 and the health workers in Jambiani, Zanzibar in 2015, learning from and supporting the effective use of existing data tools – and building and reinforcing those skills with these local decision-makers can lead to improved services and better health outcomes for families. Empowering health staff in data use is a key to success that is well-worth the investment.